
监控篇——部署Prometheus+Grafana
一、安装准备
以下部署场景BASE docker-ce、docker-compose环境
- 导入镜像包
docker load < grafana.tar
docker load < prom.tar
2. 新建数据目录
mkdir -p /data/prometheus/二、安装部署
- docker-compose配置
cat docker-compose.yml
version: '2'
networks:
monitor:
driver: bridge
services:
prometheus:
image: prom/prometheus
container_name: prometheus
hostname: prometheus
restart: always
volumes:
- /data/promethus/prometheus.yml:/etc/prometheus/prometheus.yml #数据
文件目录
ports:
- "9090:9090"
networks:
- monitor
grafana:
image: grafana/grafana
container_name: grafana
hostname: grafana
restart: always
environment:
- GF_SECURITY_ADMIN_PASSWORD=pass #grafana面板登录的密码
ports:
- "3000:3000"
networks:
- monitor
node-exporter:
image: quay.io/prometheus/node-exporter
container_name: node-exporter
hostname: node-exporter
restart: always
ports:
- "9100:9100"
networks:
- monitor
cat prometheus.yml #此配置放在挂载的目录下(/data/prometheus/)
# my global config
global:
scrape_interval: 15s # Set the scrape interval to every 15 seconds. Default
is every 1 minute.
evaluation_interval: 15s # Evaluate rules every 15 seconds. The default is
every 1 minute.
# scrape_timeout is set to the global default (10s).
# A scrape configuration containing exactly one endpoint to scrape:
# Here it's Prometheus itself.
scrape_configs:
# The job name is added as a label `job=<job_name>` to any timeseries scraped
from this config.
- job_name: 'prometheus'
static_configs:
- targets: ['192.168.1.81:9090']
- job_name: 'server' #服务器分组组名
scrape_interval: 8s
static_configs:
- targets: ['192.168.1.81:9100'] #添加客户端(要监控的AP)的IP,9100是nodeagent的端口
- targets: ['192.168.1.82:9100']
- targets: ['192.168.1.160:9100']
- targets: ['192.168.1.248:9100']
- job_name: mysql #可以部署mysql性能项目的监控
static_configs:
- targets: ['192.168.1.160:9104'] ##添加客户端(要监控的DB)IP,9104是mysqlagent的端口
labels:
instance: pre-product_mysql_192.168.1.160
2. 然后执行docker-compose up执行部署
nohup docker-compose up &三、配置node-agent
- 拷贝安装包node_exporter-0.18.1.linux-amd64.tar.gz到root目录下
cat install_node.sh
#!/bin/bash
#Author: starz
cat << EOF
+------------------------------------------------------------------+
| ** Welcome to install prometheus node_exporter for CentOS 7 OS|
+------------------------------------------------------------------+
EOF
function format() {
echo -e "\033[32m Success!!! \033[0m\n"
echo "#########################################################"
}
#mkdir dir
echo "set prometheus node-exporter dir"
dir=/opt/prometheus/
if [ ! -d $dir ]; then
mkdir -p /opt/prometheus/
fi
format
#download node_exporter-0.18.1.linux-amd64.tar.gz
echo "download and tar prometheus node_exporter-0.18.1.linux-amd64.tar.gz in
root"
#cd /root && wget
https://github.com/prometheus/node_exporter/releases/download/v0.18.1/node_expor
ter-0.18.1.linux-amd64.tar.gz
node_exporter_file=/root/node_exporter-0.18.1.linux-amd64.tar.gz
if [ ! -f $node_exporter_file ]; then
echo "no node_exporter-0.18.1.linux-amd64.tar.gz in root!"
exit
else
cd /root/
tar xzvf /root/node_exporter-0.18.1.linux-amd64.tar.gz
mv /root/node_exporter-0.18.1.linux-amd64 /opt/prometheus/
format
fi
# useadd prometheus
echo "useadd prometheus user"
useradd -s /sbin/nologin -M prometheus
format
# chown prometheus and ln -s
echo "chown prometheus and ln -s"
cd /opt/prometheus/
chown -R prometheus.prometheus /opt/prometheus/node_exporter-0.18.1.linuxamd64/
ln -s /opt/prometheus/node_exporter-0.18.1.linux-amd64/
/opt/prometheus/node_exporter
format
# config prometheus /usr/lib/systemd/system/node_exporter.service
echo "touch /usr/lib/systemd/system/node_exporter.service"
touch /usr/lib/systemd/system/node_exporter.service
cat > /usr/lib/systemd/system/node_exporter.service << EOF
[Unit]
Description=node_exporter
Documentation=https://prometheus.io/
After=network.target
[Service]
Type=simple
User=prometheus
ExecStart=/opt/prometheus/node_exporter/node_exporter
Restart=on-failure
[Install]
WantedBy=multi-user.target
EOF
systemctl start node_exporter.service
systemctl enable node_exporter.service
format
2.执行chomd +x install_node.sh
3. 执行./install_node.sh进行客户端安装
4. 验证端口

###在生产环境中,因为有大量的服务器需要安装,由于考虑到时间成本,建议用ansibe进行批量处理
agent端的安装###
四、使用ansible批量部署node—agent
cat install_node.yml
- hosts: all
remote_user: root
tasks:
- name: 发送客户端安装包
copy: src=./node_exporter-0.18.1.linux-amd64.tar.gz dest=/root/
- name: 发送安装脚本
copy: src=./install_node.sh dest=/root/
- name: 执行安装
shell: cd /root && sh install_node.sh
- name: 检查端口
shell: netstat -ant |grep 9100
1.执行批量安装
ansible-playbook -i /etc/ansible/all install_node.yml五、界面使用
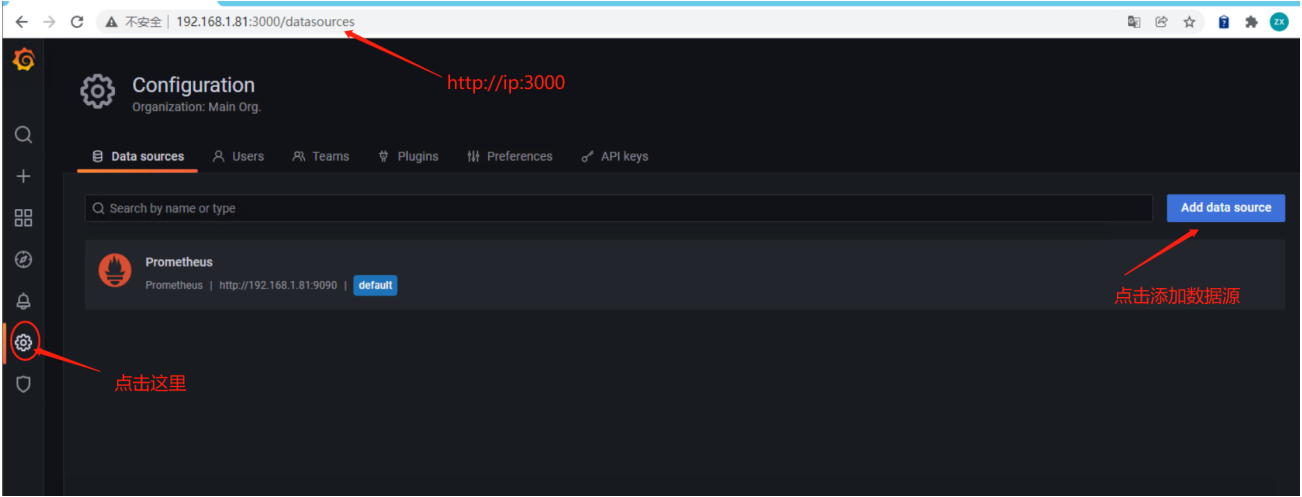
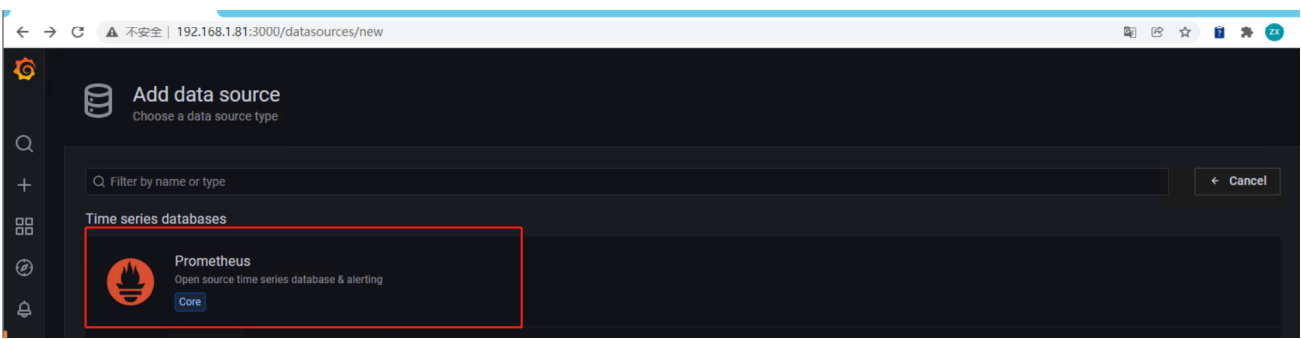
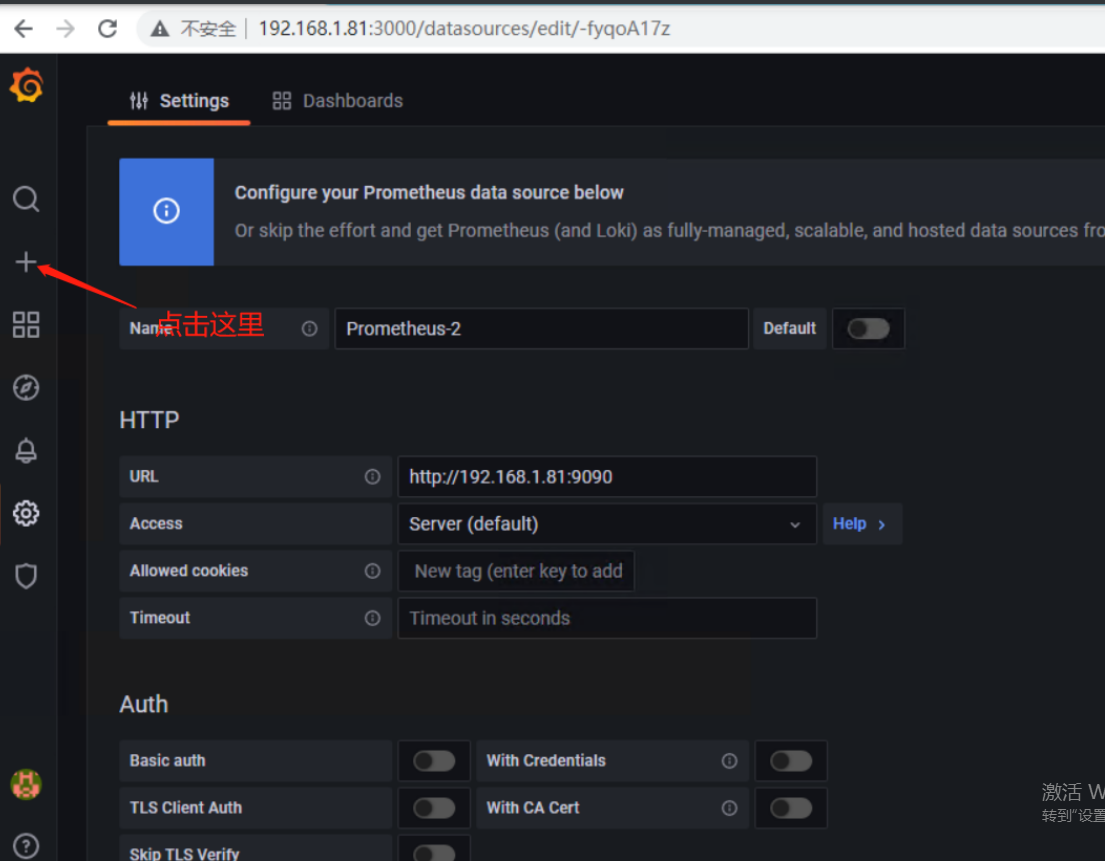
1.首次使用需要配置数据源
浏览器打开http://ip:3000
点击左侧的齿轮按钮

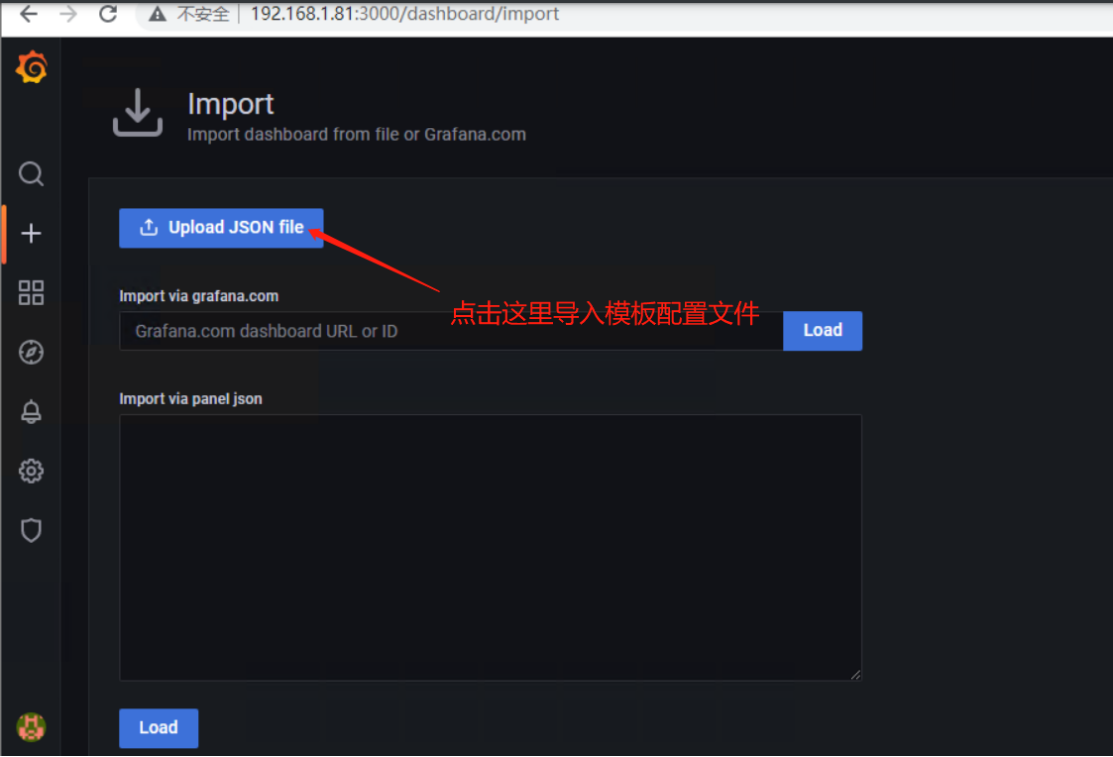
2.导入监控模板
点击import
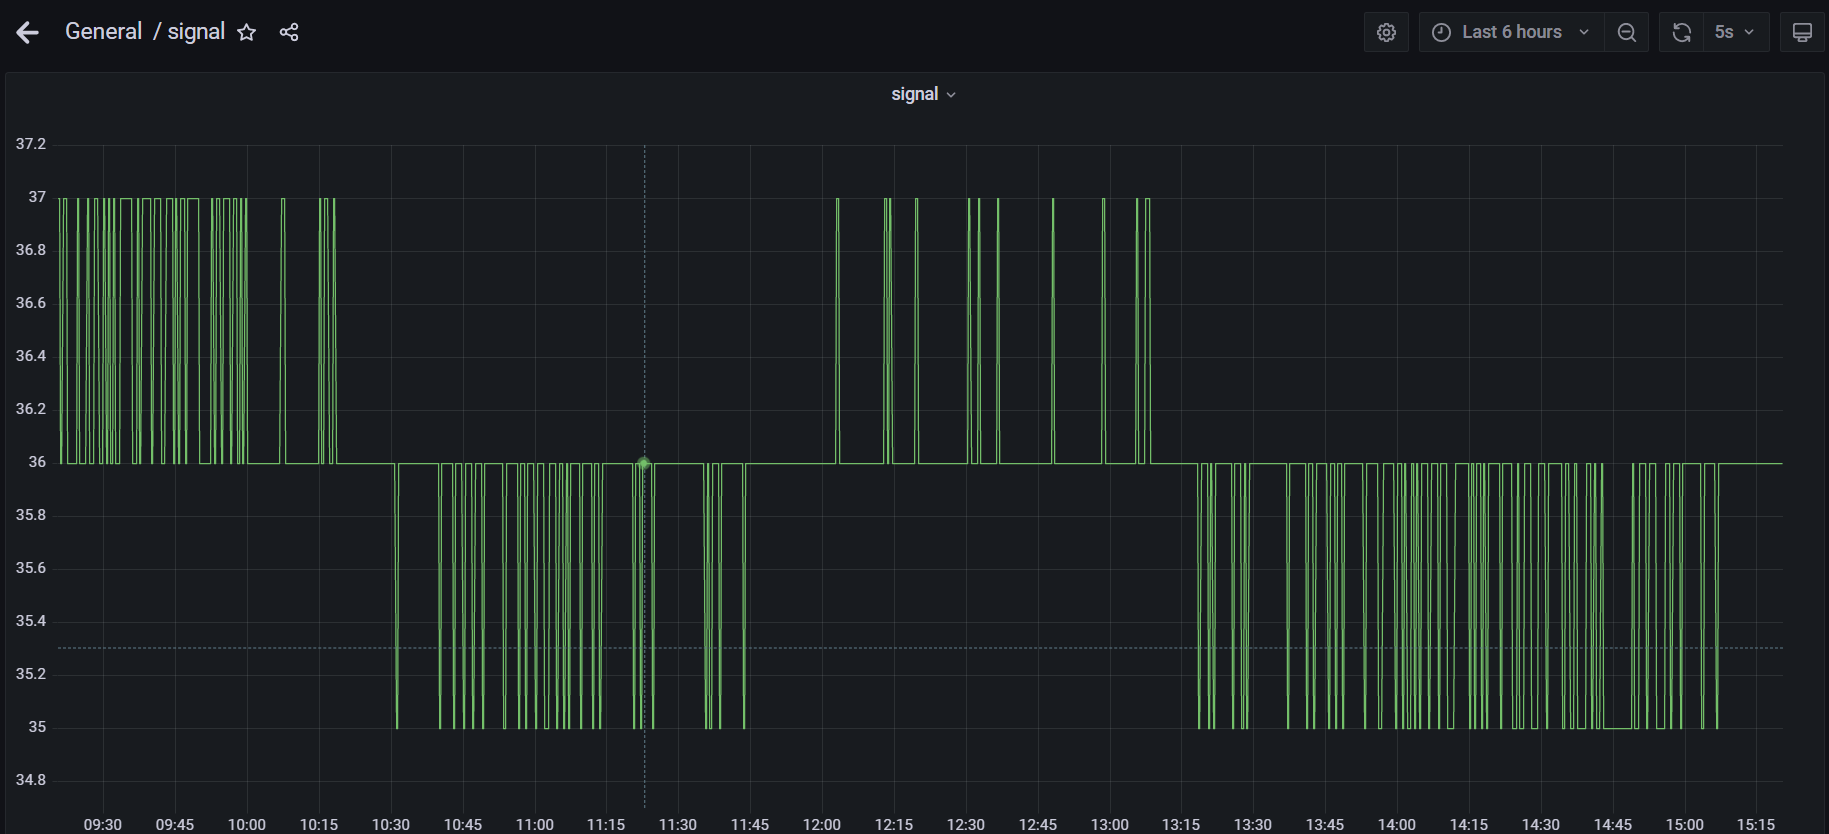
六、效果
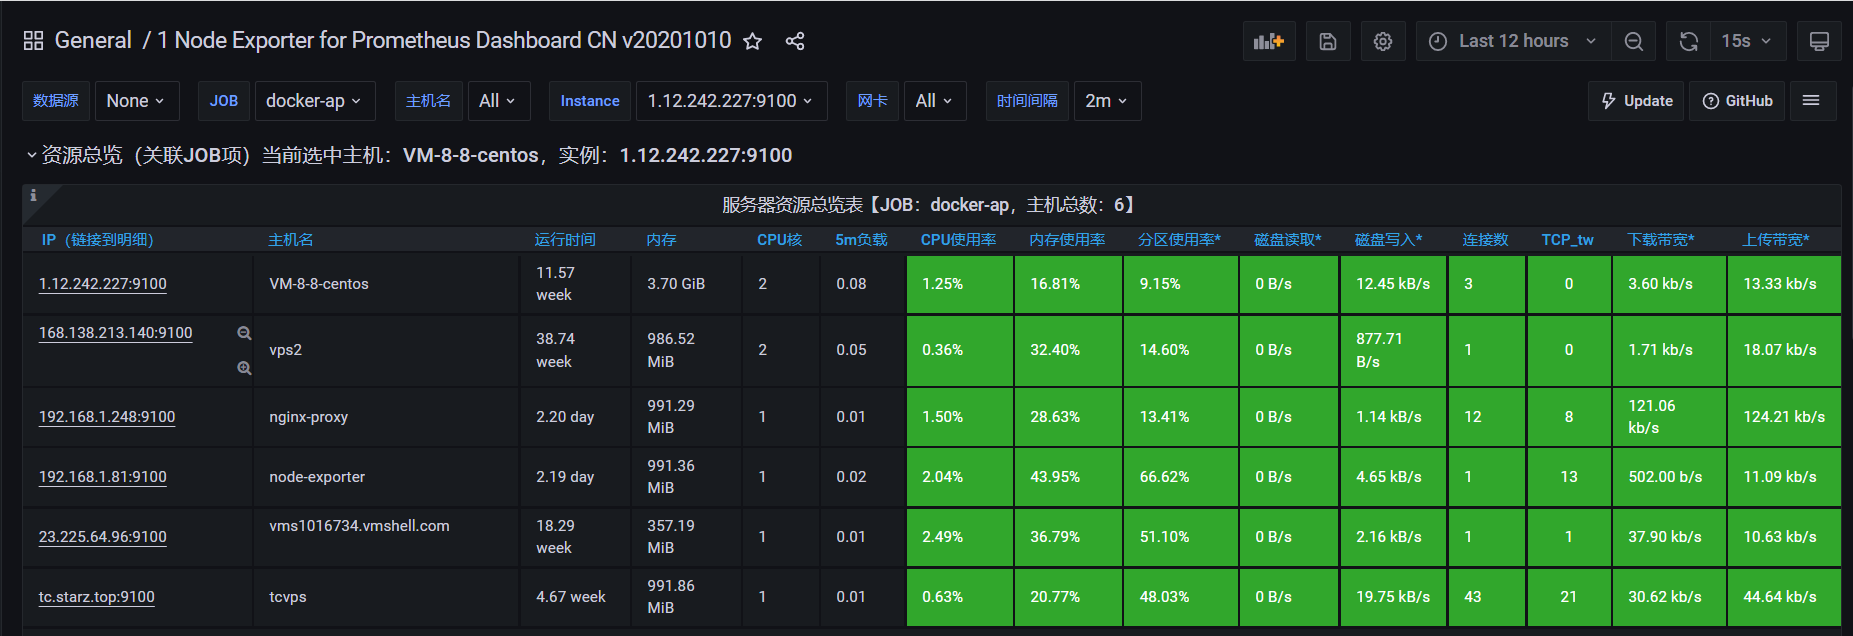
联调K8S集群的普罗米修斯

自定义收集开源设备数据
原创文章,作者:admin,如若转载,请注明出处:https://www.starz.top/2022/07/05/%e7%9b%91%e6%8e%a7%e7%af%87-%e9%83%a8%e7%bd%b2prometheusgrafana/
相关推荐
-
监控篇——部署AlertManager+企业微信告警
一、安装准备 以下基于场景prometheus环境 下载安装包 2. 部署安装包 二、部署 1.修改alertmanager.yml配置 cat /usr/local/alertm…
-
日志篇——部署ELK日志系统
一、安装准备 以下部署场景BASE docker-ce、docker-compose环境 导入镜像包 2. 新建文件夹 3. 修改一下logstash配置 cat logstash…
-
DEVOPS系列-部署DEVOPS一体化环境
一、环境介绍 下面环境部署集成在一台机器上 Jenkins JDK环境 Jenkins环境 Gitlab环境 Gitlab安装配置文件(基于docker-compose快速安装) …
-
BLOG DB高可用实施
一、部署环境 先克隆两台centos7的虚拟机 主机名:haproxykeepalived-3、4 关闭防火墙、selinux 1.haproxy部署(两台同步进行) 安装依赖 […
-
快速高效部署k8s高可用集群
一、安装组件准备 节点规划 HA(Keepalived+haproxy) 安装的服务器: 2. DOCKER CE安装包 这里用ansible进行对6个节点进行安装 3. 其他的R…
-
Ansible之实施自动发布
前言 在一些比较大的IT公司是部署了很多的前端服务器,一套生产环境就可能有上几十台服务器,所以继续沿用人工发布的话会浪费时间和出错的概率,…
-
DEVOPS系列–Gitlab的部署和参数设置
一、部署gitlab 1.基于docker-compose环境部署gitlab 2. 默认密码查看 3. 设置ssh-key 二、gitlab的使用 1.新建项目 创建后会得到一个…
