
一、安装准备
以下部署场景BASE docker-ce、docker-compose环境
- 导入镜像包
docker load < elasticsearch.tar
docker load < kibana.tar
docker load < logstash.tar
2. 新建文件夹
mkdir -p /data/elasticsearch/plugins
mkdir -p /data/elasticsearch/data
mkdir -p /data/logstash
chmod -R 777 /data/elasticsearch
3. 修改一下logstash配置
sed -i s/192.168.1.250/ ip -4 addr show eth0 | grep -oP '(?<=inet\s)\d+(\.\d+){3}' /g
logstash.conf
cat logstash.conf
input {
  beats {
     port => 5044
     codec => plain {
           charset => "UTF-8"
     }
  }
}
output {
  elasticsearch {
    hosts => "192.168.1.250:9200"
    manage_template => false
    index => "%{[@metadata][beat]}-%{+YYYY.MM.dd}"
    document_type => "%{[@metadata][type]}"
  }
}
cp logstash.conf /data/logstash二、部署
- docker-compose配置
- cat docker-compose.yml
version: '3'
services:
elasticsearch:
image: elasticsearch:7.6.2
container_name: elasticsearch
user: root
environment:
- "cluster.name=elasticsearch" #设置集群名称为elasticsearch
- "discovery.type=single-node" #以单一节点模式启动
- "ES_JAVA_OPTS=-Xms512m -Xmx512m" #设置使用jvm内存大小
volumes:
- /data/elasticsearch/plugins:/usr/share/elasticsearch/plugins #插件文件挂载
- /data/elasticsearch/data:/usr/share/elasticsearch/data #数据文件挂载
ports:
- 9200:9200
- 9300:9300
logstash:
image: logstash:7.6.2
container_name: logstash
environment:
- TZ=Asia/Shanghai
volumes:
- /data/logstash/logstash.conf:/usr/share/logstash/pipeline/logstash.conf
depends_on:
- elasticsearch #kibana在elasticsearch启动之后再启动
links:
- elasticsearch:es #可以用es这个域名访问elasticsearch服务
ports:
- 5044:5044
kibana:
image: kibana:7.6.2
container_name: kibana
links:
- elasticsearch:es #可以用es这个域名访问elasticsearch服务
depends_on:
- elasticsearch #kibana在elasticsearch启动之后再启动
environment:
- "elasticsearch.hosts=http://es:9200" #设置访问elasticsearch的地址
ports:
- 5601:5601
3. 然后执行docker-compose up执行部署
三、配置filebeat日志采集客户端
1.拷贝安装包filebeat-7.16.2-x86_64.rpm到root目录下
执行rpm -ivh filebeat-7.16.2-x86_64.rpm
vi /etc/filebeat/filebeat.yaml
    ###################### Filebeat Configuration Example #########################

    # This file is an example configuration file highlighting only the most common
    # options. The filebeat.reference.yml file from the same directory contains all the
    # supported options with more comments. You can use it as a reference.
    #
    # You can find the full configuration reference here:
    # https://www.elastic.co/guide/en/beats/filebeat/index.html

    # For more available modules and options, please see the filebeat.reference.yml sample
    # configuration file.

    #=========================== Filebeat inputs =============================

    filebeat.inputs:

    # Each - is an input. Most options can be set at the input level, so
    # you can use different inputs for various configurations.
    # Below are the input specific configurations.

    - type: log

      # Change to true to enable this input configuration.
      enabled: true                                      #开启日志采集

      # Paths that should be crawled and fetched. Glob based paths.
      paths:
        - /var/log/*.log                                 #配置日志采集路径
        #- c:\programdata\elasticsearch\logs\*

      # Exclude lines. A list of regular expressions to match. It drops the lines that are
      # matching any regular expression from the list.
      #exclude_lines: ['^DBG']

      # Include lines. A list of regular expressions to match. It exports the lines that are
      # matching any regular expression from the list.
      #include_lines: ['^ERR', '^WARN']

      # Exclude files. A list of regular expressions to match. Filebeat drops the files that
      # are matching any regular expression from the list. By default, no files are dropped.
      #exclude_files: ['.gz$']

      # Optional additional fields. These fields can be freely picked
      # to add additional information to the crawled log files for filtering
      #fields:
      #  level: debug
      #  review: 1

      ### Multiline options

      # Multiline can be used for log messages spanning multiple lines. This is common
      # for Java Stack Traces or C-Line Continuation

      # The regexp Pattern that has to be matched. The example pattern matches all lines starting with [
      #multiline.pattern: ^\[

      # Defines if the pattern set under pattern should be negated or not. Default is false.
      #multiline.negate: false

      # Match can be set to "after" or "before". It is used to define if lines should be append to a pattern
      # that was (not) matched before or after or as long as a pattern is not matched based on negate.
      # Note: After is the equivalent to previous and before is the equivalent to to next in Logstash
      #multiline.match: after


    #============================= Filebeat modules ===============================

    filebeat.config.modules:
      # Glob pattern for configuration loading
      path: ${path.config}/modules.d/*.yml

      # Set to true to enable config reloading
      reload.enabled: false

      # Period on which files under path should be checked for changes
      #reload.period: 10s

    #==================== Elasticsearch template setting ==========================

    setup.template.settings:
      index.number_of_shards: 3
      #index.codec: best_compression
      #_source.enabled: false

    #================================ General =====================================

    # The name of the shipper that publishes the network data. It can be used to group
    # all the transactions sent by a single shipper in the web interface.
    #name:

    # The tags of the shipper are included in their own field with each
    # transaction published.
    #tags: ["service-X", "web-tier"]

    # Optional fields that you can specify to add additional information to the
    # output.
    #fields:
    #  env: staging


    #============================== Dashboards =====================================
    # These settings control loading the sample dashboards to the Kibana index. Loading
    # the dashboards is disabled by default and can be enabled either by setting the
    # options here, or by using the `-setup` CLI flag or the `setup` command.
    #setup.dashboards.enabled: false

    # The URL from where to download the dashboards archive. By default this URL
    # has a value which is computed based on the Beat name and version. For released
    # versions, this URL points to the dashboard archive on the artifacts.elastic.co
    # website.
    #setup.dashboards.url:

    #============================== Kibana =====================================

    # Starting with Beats version 6.0.0, the dashboards are loaded via the Kibana API.
    # This requires a Kibana endpoint configuration.
    setup.kibana:

      # Kibana Host
      # Scheme and port can be left out and will be set to the default (http and 5601)
      # In case you specify and additional path, the scheme is required: http://localhost:5601/path
      # IPv6 addresses should always be defined as: https://[2001:db8::1]:5601
      host: "192.168.1.250:5601"

      # Kibana Space ID
      # ID of the Kibana Space into which the dashboards should be loaded. By default,
      # the Default Space will be used.
      #space.id:

    #============================= Elastic Cloud ==================================

    # These settings simplify using filebeat with the Elastic Cloud (https://cloud.elastic.co/).

    # The cloud.id setting overwrites the `output.elasticsearch.hosts` and
    # `setup.kibana.host` options.
    # You can find the `cloud.id` in the Elastic Cloud web UI.
    #cloud.id:

    # The cloud.auth setting overwrites the `output.elasticsearch.username` and
    # `output.elasticsearch.password` settings. The format is `<user>:<pass>`.
    #cloud.auth:

    #================================ Outputs =====================================

    # Configure what output to use when sending the data collected by the beat.

    #-------------------------- Elasticsearch output ------------------------------
    #output.elasticsearch:                  #注意这里需要加注释,否则不能启动服务
      # Array of hosts to connect to.       #注意这里需要加注释,否则不能启动服务
      #hosts: ["localhost:9200"]            #注意这里需要加注释,否则不能启动服务

      # Enabled ilm (beta) to use index lifecycle management instead daily indices.
      #ilm.enabled: false

      # Optional protocol and basic auth credentials.
      #protocol: "https"
      #username: "elastic"
      #password: "changeme"

    #----------------------------- Logstash output --------------------------------
    output.logstash:                       #开启logstash模式
      # The Logstash hosts
      hosts: ["192.168.1.250:5044"]        #logstash服务端口

      # Optional SSL. By default is off.
      # List of root certificates for HTTPS server verifications
      #ssl.certificate_authorities: ["/etc/pki/root/ca.pem"]

      # Certificate for SSL client authentication
      #ssl.certificate: "/etc/pki/client/cert.pem"

      # Client Certificate Key
      #ssl.key: "/etc/pki/client/cert.key"

    #================================ Processors =====================================

    # Configure processors to enhance or manipulate events generated by the beat.

    processors:
      # - add_host_metadata: ~
      # - add_cloud_metadata: ~

    #================================ Logging =====================================

    # Sets log level. The default log level is info.
    # Available log levels are: error, warning, info, debug
    #logging.level: debug

    # At debug level, you can selectively enable logging only for some components.
    # To enable all selectors use ["*"]. Examples of other selectors are "beat",
    # "publish", "service".
    #logging.selectors: ["*"]

    #============================== Xpack Monitoring ===============================
    # filebeat can export internal metrics to a central Elasticsearch monitoring
    # cluster.  This requires xpack monitoring to be enabled in Elasticsearch.  The
    # reporting is disabled by default.

    # Set to true to enable the monitoring reporter.
    #xpack.monitoring.enabled: false

    # Uncomment to send the metrics to Elasticsearch. Most settings from the
    # Elasticsearch output are accepted here as well. Any setting that is not set is
    # automatically inherited from the Elasticsearch output configuration, so if you
    # have the Elasticsearch output configured, you can simply uncomment the
    # following line.
    #xpack.monitoring.elasticsearch:
2. 执行systemctl start filebeat && systemctl enable filebeat
3. 检查systemctl status filebeat
四、使用ansible批量部署filebeat
cat install_filebeat.yml
    - hosts: all
      remote_user: root

      tasks:
        - name: 发送客户端安装包
          copy: src=./filebeat-7.16.2-x86_64.rpm  dest=/root/

        - name: 执行安装
          shell: cd /root && rpm -ivh filebeat-7.16.2-x86_64.rpm

        - name: 复制配置文件
          copy: src=./filebeat.yml dest=/etc/filebeat

        - name: 启动filebeat
          shell: systemctl start filebeat && systemctl enable filebeat

        - name: 检查filebeat状态
shell: systemctl status filebeat- 执行批量安装
ansible-playbook -i /etc/ansible/all install_filebeat.yml
五、界面使用
- 首次使用需要配置日志模型
浏览器打开http://ip:5601
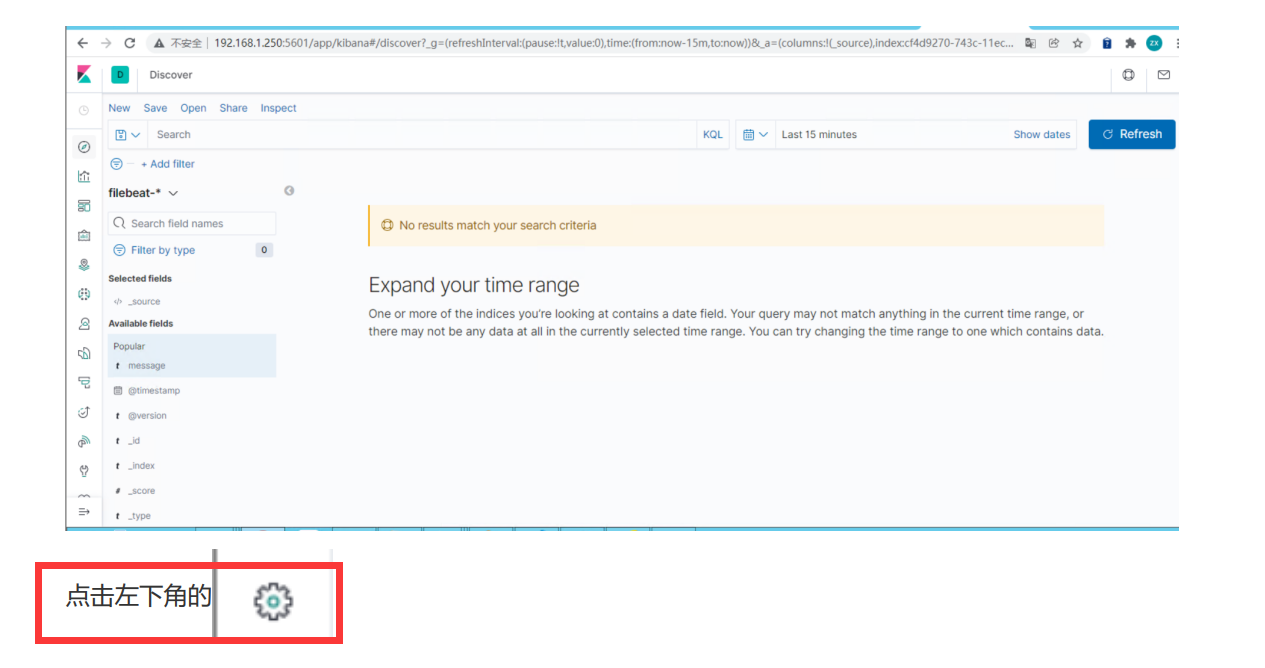
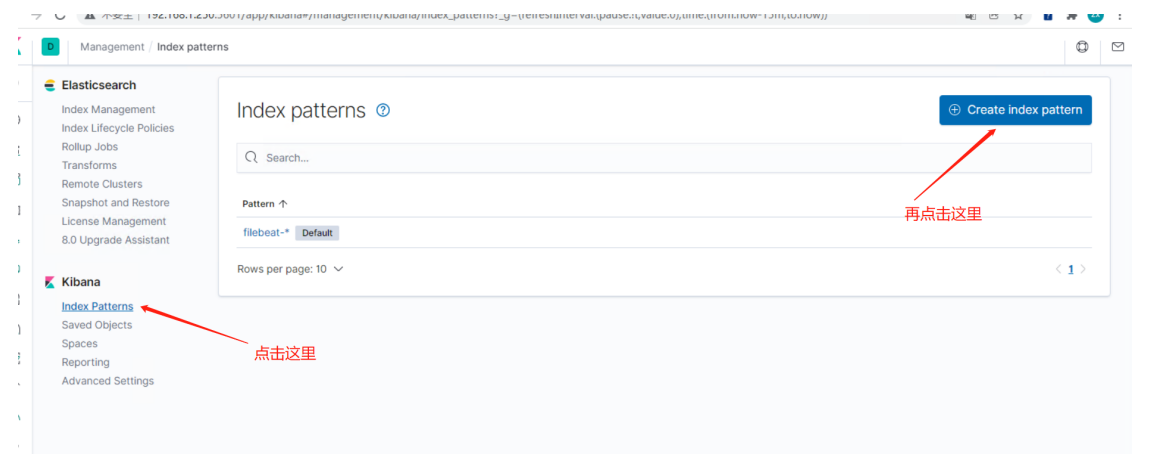
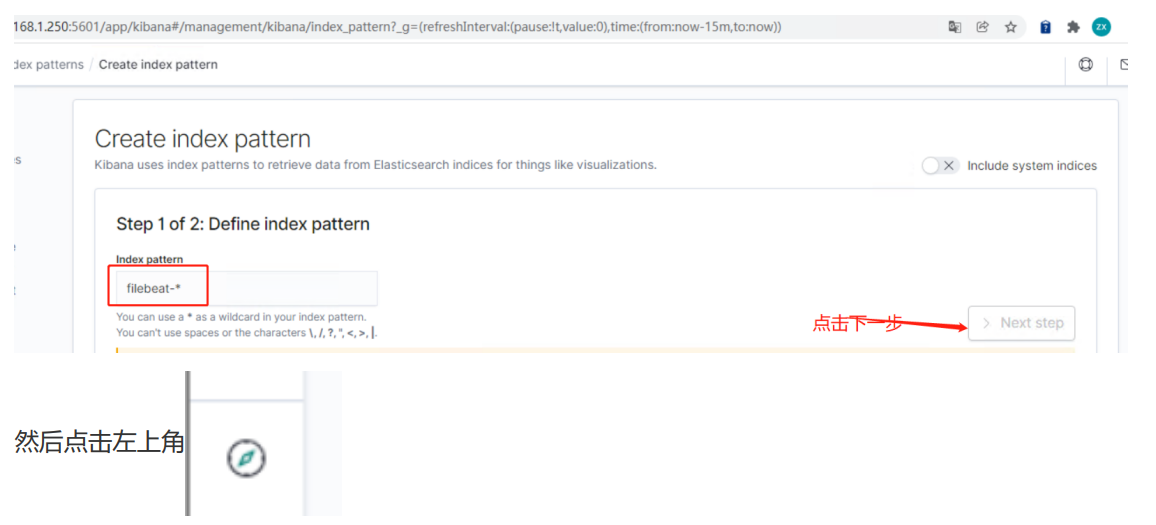
2. 创建模型
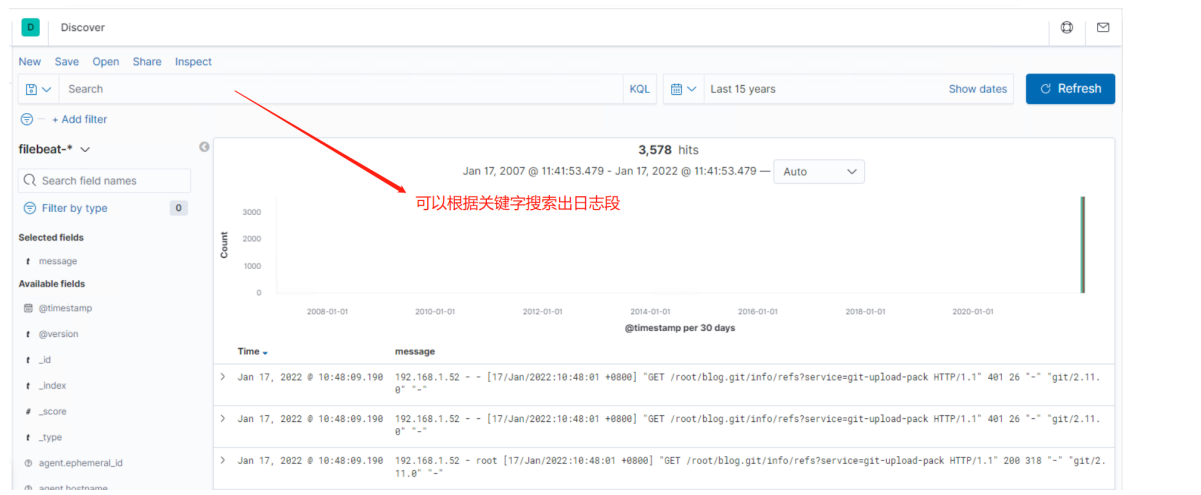
3. 效果
原创文章,作者:admin,如若转载,请注明出处:https://www.starz.top/2022/07/05/%e6%97%a5%e5%bf%97%e7%af%87-%e9%83%a8%e7%bd%b2elk%e6%97%a5%e5%bf%97%e7%b3%bb%e7%bb%9f/
相关推荐
-
快速高效部署k8s高可用集群
一、安装组件准备 节点规划 HA(Keepalived+haproxy) 安装的服务器: 2. DOCKER CE安装包 这里用ansible进行对6个节点进行安装 3. 其他的R…
-
BLOG DB高可用实施
一、部署环境 先克隆两台centos7的虚拟机 主机名:haproxykeepalived-3、4 关闭防火墙、selinux 1.haproxy部署(两台同步进行) 安装依赖 […
-
监控篇——部署Prometheus+Grafana
一、安装准备 以下部署场景BASE docker-ce、docker-compose环境 导入镜像包 2. 新建数据目录 二、安装部署 docker-compose配置 cat d…
-
DEVOPS系列-部署DEVOPS一体化环境
一、环境介绍 下面环境部署集成在一台机器上 Jenkins JDK环境 Jenkins环境 Gitlab环境 Gitlab安装配置文件(基于docker-compose快速安装) …
-
DEVOPS系列–Gitlab的部署和参数设置
一、部署gitlab 1.基于docker-compose环境部署gitlab 2. 默认密码查看 3. 设置ssh-key 二、gitlab的使用 1.新建项目 创建后会得到一个…
-
Ansible之实施自动发布
前言 在一些比较大的IT公司是部署了很多的前端服务器,一套生产环境就可能有上几十台服务器,所以继续沿用人工发布的话会浪费时间和出错的概率,…
-
监控篇——部署AlertManager+企业微信告警
一、安装准备 以下基于场景prometheus环境 下载安装包 2. 部署安装包 二、部署 1.修改alertmanager.yml配置 cat /usr/local/alertm…
